QCustomSparkline
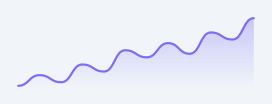
A compact, axis-less trend line.
A tiny inline chart for KPI cards / tables: a smooth (cubic) or straight
polyline across a value series, with an optional soft gradient fill beneath
it. No axes, grid, legend or toolbar - just the shape of the trend. Colours
come from qproperties so they can be tokenised from a theme. Give values via
setValues([...]) in code, or the valuesCsv property in Qt Designer.
At a glance
| Tier | Free (GPLv3) |
| Import | from Custom_Widgets.QCustomSparkline import QCustomSparkline |
| Qt Designer | Yes — drag it from the palette |
Quick start
from Custom_Widgets.QCustomSparkline import QCustomSparkline

widget = QCustomSparkline()
Dark theme
Colours come from the design tokens, so the widget follows the app theme with no extra work.

Properties
Every property below is settable in code and in Qt Designer.
| Property | Type | Default |
|---|---|---|
valuesCsv | string | — |
lineColor | color | — |
fillColor | color | — |
fillEnabled | bool | True |
fillOpacity | float | 0.35 |
lineWidth | float | 2.2 |
smooth | bool | True |
seriesCsv | string | — |
seriesColorsCsv | string | — |
Methods
| Method | Description |
|---|---|
clear() | Clear. |
fillColor(*args, **kwargs) | Fill color. |
fillEnabled(*args, **kwargs) | Fill enabled. |
fillOpacity(*args, **kwargs) | Fill opacity. |
lineColor(*args, **kwargs) | Line color. |
lineWidth(*args, **kwargs) | Line width. |
series() | Series. |
seriesColorsCsv(*args, **kwargs) | Series colors csv. |
seriesCsv(*args, **kwargs) | Series csv. |
setSeries(series, colors=None) | Draw MULTIPLE overlaid lines sharing one y-scale. series is a list |
setSeriesColors(colors) | Set the series colors. |
setValues(values) | Set the values. |
smooth(*args, **kwargs) | Smooth. |
values() | Values. |
valuesCsv(*args, **kwargs) | Values csv. |
Related
QCustomAreaChart · QCustomBarChart · QCustomBeeswarm · QCustomBubbleChart · QCustomCandlestickChart · QCustomCompass · QCustomCompassDial · QCustomDivergingBarChart