QCustomFunnelChart
QCustomFunnelChart ships in Custom Widgets Pro. It is not part of the free GPLv3 package from 2.6.0 onward — the free package keeps the import path so Qt Designer forms still load, and installing Pro activates the widget with no code change. Releases up to 2.5.0 included it under the GPLv3.
Pro is licensed software and is not installable from PyPI — the name there is a pointer package with no widgets in it. Licence holders download the wheel from their account:
# https://portal.customwidgets.org/downloads
pip install <the downloaded .whl>
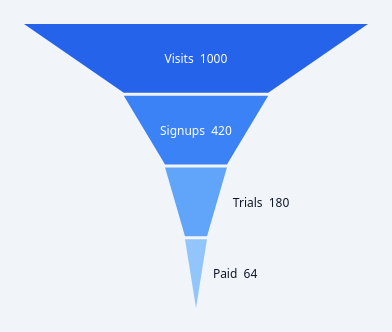
A painted funnel / pyramid chart.
Stacked trapezoid stages narrowing toward the end: a conversion funnel, a sales pipeline, a drop-off analysis. Each stage's width encodes its value and the taper between stages is the loss.
Pyramid is the SAME chart inverted, so it is a shape property rather than
a second widget - MUI ships them as two components, which duplicates every
property for one flipped polygon.
QPainter only, NO QtCharts (see docs/design/mui-charts-gap.md).
Data goes in with setStages([...]) in code, or stagesCsv in Qt Designer:
stagesCsv = "Visits=1000,Signups=420,Trials=180,Paid=64"
Emits stageHovered(int) and stageClicked(int); -1 means "nothing".
At a glance
| Tier | Pro |
| Import | from Custom_Widgets.QCustomFunnelChart import QCustomFunnelChart |
| Qt Designer | Yes — drag it from the palette |
Quick start
from Custom_Widgets.QCustomFunnelChart import QCustomFunnelChart

widget = QCustomFunnelChart()
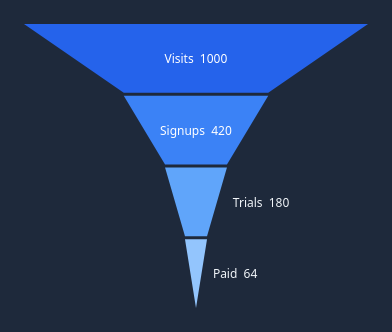
Dark theme
Colours come from the design tokens, so the widget follows the app theme with no extra work.
Properties
Every property below is settable in code and in Qt Designer.
| Property | Type | Default |
|---|---|---|
stagesCsv | string | — |
colorsCsv | string | — |
shape | enum: funnel/pyramid`` | funnel |
orientation | enum: vertical/horizontal`` | vertical |
gapPx | int | 3 |
neckRatio | float | 0.0 |
showLabels | bool | True |
showValues | bool | True |
showPercent | bool | False |
percentOf | enum: first/previous`` | first |
labelColor | color | #ffffff |
outsideLabelColor | color | #0f172a |
Signals
| Signal |
|---|
stageClicked(int) |
stageHovered(int) |
Methods
| Method | Description |
|---|---|
bands() | Bands. |
clearStages() | Clear the stages. |
colorsCsv(*args, **kwargs) | Colors csv. |
gapPx(*args, **kwargs) | Gap px. |
labelColor(*args, **kwargs) | Label color. |
maximum() | The value the widest band represents; never zero. |
neckRatio(*args, **kwargs) | Neck ratio. |
orientation(*args, **kwargs) | Orientation. |
outsideLabelColor(*args, **kwargs) | Outside label color. |
percentFor(index) | Conversion percentage for a stage, per percentOf. |
percentOf(*args, **kwargs) | Percent of. |
setStages(stages) | Set the stages. |
shape(*args, **kwargs) | Shape. |
showLabels(*args, **kwargs) | Show the labels. |
showPercent(*args, **kwargs) | Show the percent. |
showValues(*args, **kwargs) | Show the values. |
stageAt(pos) | Stage at. |
stageClicked(...) | Stage clicked. |
stageColor(index) | Stage color. |
stageCount() | Stage count. |
stageHovered(...) | Stage hovered. |
stages() | Stages. |
stagesCsv(*args, **kwargs) | Stages csv. |
Theming
Colours come from the design tokens, so they follow the active theme. Roles used: on-primary, on-surface.
See Design tokens.
Related
QCustomAreaChart · QCustomBarChart · QCustomBeeswarm · QCustomBubbleChart · QCustomCandlestickChart · QCustomCompass · QCustomCompassDial · QCustomDivergingBarChart