QCustomPieChart
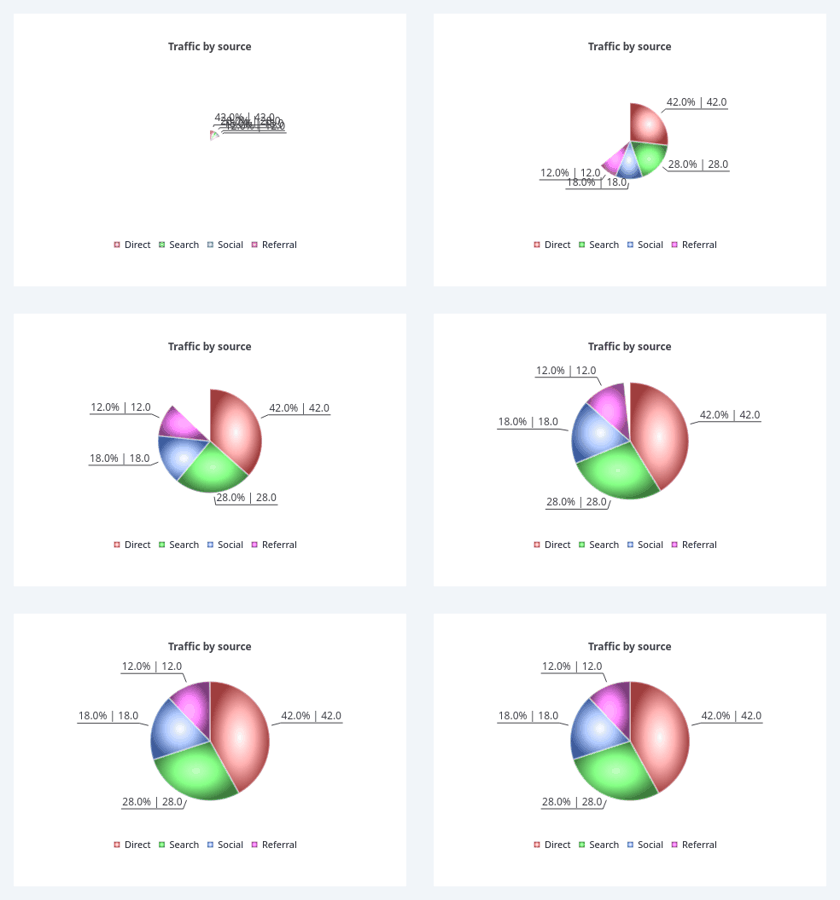
Pie chart implementation using the modular architecture.
Qt Designer compatible with property exposure.
At a glance
| Tier | Free (GPLv3) |
| Import | from Custom_Widgets.QCustomCharts.QCustomPieChart import QCustomPieChart |
| Qt Designer | Yes — drag it from the palette |
Quick start
from Custom_Widgets.QCustomCharts.QCustomPieChart import QCustomPieChart

widget = QCustomPieChart()
widget.categoriesCsv = "Direct,Search,Social,Referral"
widget.seriesCsv = "Sessions=42,28,18,12"
_chartPresentation(w, theme, "Traffic by source", None, None)
That is the exact code behind the screenshot above.
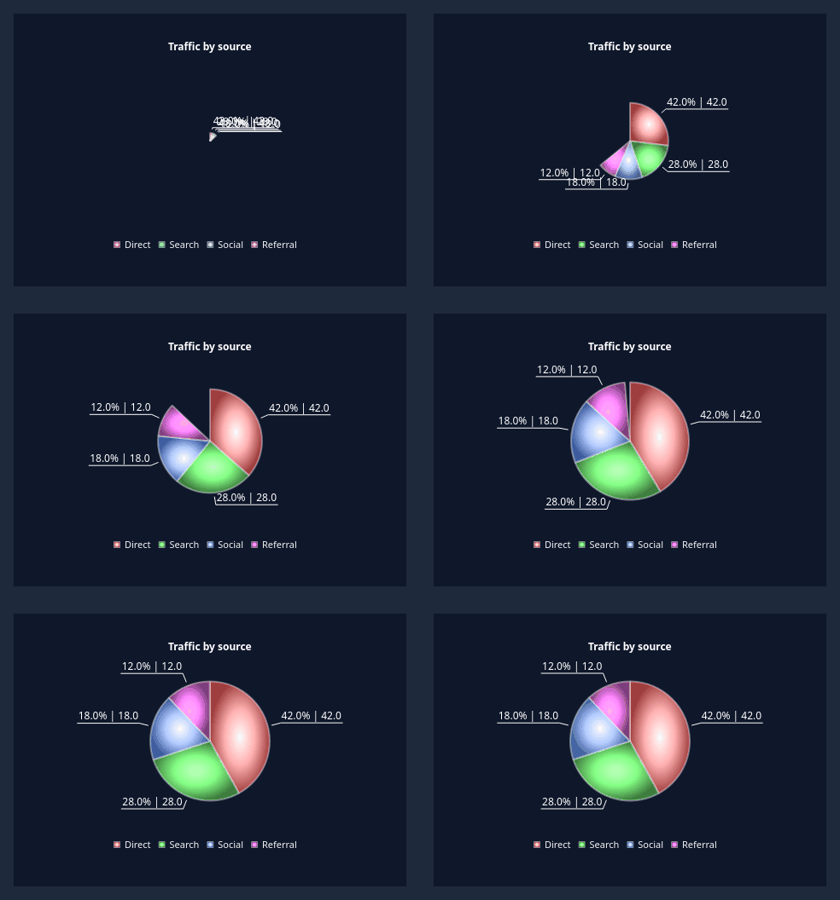
Dark theme
Colours come from the design tokens, so the widget follows the app theme with no extra work.
Properties
Every property below is settable in code and in Qt Designer.
| Property | Type | Default |
|---|---|---|
showPercentages | bool | True |
showValues | bool | True |
showLegend | bool | True |
showLabels | bool | True |
labelsPosition | int | 0 |
showPercentLabels | bool | False |
hatchCsv | string | — |
hatchPattern | string | bdiag |
explosionDistance | float | 0.1 |
holeSize | float | 0.0 |
startAngle | float | 0.0 |
endAngle | float | 360.0 |
semicircleEnabled | bool | False |
pieAngularSpan | float | 180.0 |
semicircleOrientation | string | right |
gradientFill | bool | True |
gradientType | string | radial |
borderWidth | float | 2.0 |
borderColor | color | #ffffff |
legendMarkerBorderWidth | float | 1.0 |
explodeOnHover | bool | True |
hoverExplosionDistance | float | 0.15 |
chartTitle | string | Pie Chart |
animationEnabled | bool | True |
animationDuration | int | 1000 |
antialiasing | bool | True |
showToolbar | bool | False |
tooltipsEnabled | bool | True |
tooltipDelay | int | 500 |
tooltipDuration | int | 5000 |
theme | int | 0 |
legendPosition | int | 1 |
legendFontSize | int | 8 |
legendBackgroundVisible | bool | False |
compactMode | bool | False |
seriesCsv | string | — |
categoriesCsv | string | — |
Signals
| Signal |
|---|
chartExportComplete(QString,bool) |
legendPositionChanged(QString) |
seriesAdded(QString) |
seriesRemoved(QString) |
sliceClicked(QString,double) |
sliceExploded(QString,bool) |
sliceHovered(QString,double) |
Methods
| Method | Description |
|---|---|
| `addSeries(name: str, data: List[Tuple[str, float]], color: PySide6.QtGui.QColor | None = None, visible: bool = True, colors: List |
addSlice(series_name: str, slice_name: str, value: float) -> bool | Add a slice to an existing series |
applyCustomPalette(palette: PySide6.QtGui.QPalette) | Apply a custom palette to the chart (for App Theme) |
areLabelsVisible() -> bool | Check if labels are visible |
borderColor(*args, **kwargs) | Get border color |
borderWidth(*args, **kwargs) | Get border width |
chartExportComplete(...) | Chart export complete. |
clearAllData() | Clear all chart data |
clearData() | Clear all chart data (compatibility method) |
endAngle(*args, **kwargs) | Get end angle |
explodeAllSlices(explode: bool = True) | Explode or un-explode all slices |
explodeOnHover(*args, **kwargs) | Get explode on hover state |
explodeSlice(slice_name: str, explode: bool = True) | Explode or un-explode a slice |
explosionDistance(*args, **kwargs) | Get explosion distance |
exportToClipboard() | Export chart to clipboard |
exportToFile(format: str = None, filename: str = None) | Export chart to file |
generateExampleData(example_type: str = 'categories') | Generate example data for testing. |
getAvailableLegendPositions() -> List[str] | Get list of available legend positions |
getAvailableThemes() -> List[str] | Get list of available theme names |
getBorderColor() -> PySide6.QtGui.QColor | Get border color |
getBorderWidth() -> float | Get border width |
getEndAngle() -> float | Get the ending angle in degrees |
getExplosionDistance() -> float | Get the explosion distance factor |
getGradientType() -> str | Get gradient type |
getHoleSize() -> float | Get the hole size for donut chart |
getHoverExplosionDistance() -> float | Get the explosion distance factor for hover |
getLabelsPosition() -> str | Get labels position |
getLegendAlignment() -> PySide6.QtCore.Qt.AlignmentFlag | Get current legend alignment |
getLegendFontSize() -> int | Get legend font size |
getLegendMarkerBorderWidth() -> float | Get the border width for legend markers |
getPercentage(series_name: str, slice_name: str) -> float | Get the percentage of a slice |
getPieAngularSpan() -> float | Get the angular span of the pie in degrees |
getSemicircleOrientation() -> str | Get the orientation of the semicircle |
getSeriesData(name: str) -> List[Tuple[str, float]] | Get data for a specific series (pie chart version) |
getSeriesNames() -> List[str] | Get list of all series names (overrides base method) |
getSliceNames(series_name: str) -> List[str] | Get list of slice names for a series |
| `getSliceValue(series_name: str, slice_name: str) -> float | None` |
getStartAngle() -> float | Get the starting angle in degrees |
getTotalValue(series_name: str) -> float | Get the total value of all slices in a series |
gradientFill(*args, **kwargs) | Get gradient fill state |
gradientType(*args, **kwargs) | Get gradient type |
hatchCsv(*args, **kwargs) | Hatch csv. |
hatchPattern(*args, **kwargs) | Hatch pattern. |
hideTooltip() | Manually hide tooltip |
holeSize(*args, **kwargs) | Get hole size |
hoverExplosionDistance(*args, **kwargs) | Get hover explosion distance |
isExplodeOnHoverEnabled() -> bool | Check if explode on hover is enabled |
isGradientFillEnabled() -> bool | Check if gradient fill is enabled |
isSemicircleEnabled() -> bool | Check if semicircle mode is enabled |
isSliceExploded(slice_name: str) -> bool | Check if a slice is exploded |
labelsPosition(*args, **kwargs) | Labels position (int; see QCustomChartEnums.LabelsPosition). |
legendMarkerBorderWidth(*args, **kwargs) | Get legend marker border width |
legendPositionChanged(...) | Legend position changed. |
pieAngularSpan(*args, **kwargs) | Get pie angular span |
printChart() | Print chart |
refreshTheme() | Refresh the current theme (useful when app palette changes) |
removeSeries(name: str) -> bool | Remove a series from the chart |
removeSlice(series_name: str, slice_name: str) -> bool | Remove a slice from a series |
semicircleEnabled(*args, **kwargs) | Get semicircle enabled state |
semicircleOrientation(*args, **kwargs) | Get semicircle orientation |
seriesAdded(...) | Series added. |
seriesRemoved(...) | Series removed. |
setBorderColor(color: PySide6.QtGui.QColor) | Set border color |
setBorderWidth(width: float) | Set border width |
setChartTitle(title: str) | Set chart title (compatibility method) |
setEndAngle(angle: float) | Set the ending angle in degrees |
setExplodeOnHover(enabled: bool) | Enable or disable explode on hover |
setExplosionDistance(distance: float) | Set the explosion distance factor (0.0 to 1.0) |
setGradientFill(enabled: bool) | Enable or disable gradient fill |
setGradientType(gradient_type: str) | Set gradient type: 'radial' or 'conical' |
setHatchIndices(indices) | Slice indices (within the series) rendered with a hatch/pattern fill. |
setHatchPattern(name) | Set the hatch pattern. |
setHoleSize(size: float) | Set the hole size for donut chart (0.0 to 0.9) |
setHoverExplosionDistance(distance: float) | Set the explosion distance factor for hover (0.0 to 1.0) |
setLabelsPosition(position: str) | Set labels position: 'outside', 'inside', or 'callout' |
setLabelsVisible(visible: bool) | Set labels visibility |
setLegendAlignment(alignment: PySide6.QtCore.Qt.AlignmentFlag) | Directly set legend alignment |
setLegendBackgroundVisible(visible: bool) | Set legend background visibility |
setLegendFontSize(size: int) | Set legend font size |
setLegendMarkerBorderWidth(width: float) | Set the border width for legend markers |
setPieAngularSpan(span: float) | Set the angular span of the pie in degrees |
setSemicircleEnabled(enabled: bool) | Enable or disable semicircle/half pie display |
setSemicircleOrientation(orientation: str) | Set the orientation of the semicircle |
setSeriesColor(name: str, color: PySide6.QtGui.QColor) | Set color for a specific series (overrides base method) |
setSeriesVisibility(name: str, visible: bool) | Set visibility for a specific series (overrides base method) |
setShowPercentLabels(on) | Convenience: show a % label inside each slice (like QCustomDonut). |
setShowPercentages(show: bool) | Set whether to show percentages in labels |
setShowValues(show: bool) | Set whether to show values in labels |
setSliceColors(series_name: str, colors: List) -> bool | Set per-slice colours for a series and redraw. |
setStartAngle(angle: float) | Set the starting angle in degrees |
showLabels(*args, **kwargs) | Get labels visibility |
showLegend(*args, **kwargs) | Get legend visibility |
showPercentLabels(*args, **kwargs) | True when slices show a % label inside (convenience toggle). |
showPercentages(*args, **kwargs) | Get show percentages state |
showTooltipAt(x: float, y: float, slice_name: str, title: str = None, description: str = None) | Manually show tooltip at specific coordinates |
showValues(*args, **kwargs) | Get show values state |
sliceClicked(...) | Slice clicked. |
sliceExploded(...) | Slice exploded. |
sliceHovered(...) | Slice hovered. |
startAngle(*args, **kwargs) | Get start angle |
toggleSliceExplosion(slice_name: str) | Toggle explosion state of a slice |
updateChart() | Update the chart display based on current data |
updateSeriesData(name: str, data: List[Tuple[str, float]]) -> bool | Update data for an existing series |
updateSliceValue(series_name: str, slice_name: str, new_value: float) -> bool | Update the value of a slice |
Theming
Colours come from the design tokens, so they follow the active theme. Roles used: surface, on-surface, accent.
See Design tokens.
Related
QCustomAreaChart · QCustomBarChart · QCustomBeeswarm · QCustomBubbleChart · QCustomCandlestickChart · QCustomCompass · QCustomCompassDial · QCustomDivergingBarChart