QCustomSankey
QCustomSankey ships in Custom Widgets Pro. It is not part of the free GPLv3 package from 2.6.0 onward — the free package keeps the import path so Qt Designer forms still load, and installing Pro activates the widget with no code change. Releases up to 2.5.0 included it under the GPLv3.
Pro is licensed software and is not installable from PyPI — the name there is a pointer package with no widgets in it. Licence holders download the wheel from their account:
# https://portal.customwidgets.org/downloads
pip install <the downloaded .whl>
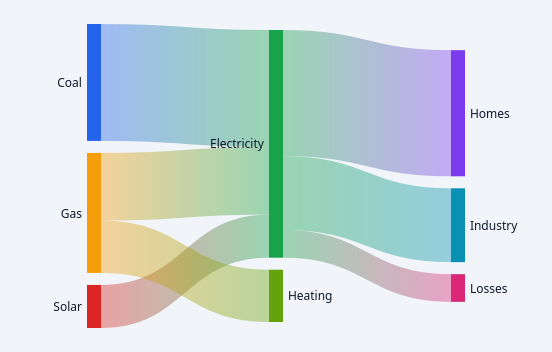
A painted Sankey flow diagram.
Nodes in columns joined by ribbons whose thickness is the quantity flowing. Energy budgets, traffic sources to conversions, spend breakdowns - anything where the interesting thing is where the volume GOES, not just its size.
The hardest of the painted charts, because nothing about the layout is given: node columns, vertical order, and the stacking of each ribbon at both ends all have to be derived from the link list alone.
QPainter only, NO QtCharts (see docs/design/mui-charts-gap.md).
Data goes in with setLinks([...]) in code, or linksCsv in Qt Designer:
linksCsv = "Search>Signup=120;Social>Signup=80;Signup>Paid=60" source > target = value, links separated by ";"
Emits linkHovered(int), nodeHovered(str) and nodeClicked(str).
At a glance
| Tier | Pro |
| Import | from Custom_Widgets.QCustomSankey import QCustomSankey |
| Qt Designer | Yes — drag it from the palette |
Quick start
from Custom_Widgets.QCustomSankey import QCustomSankey

widget = QCustomSankey()
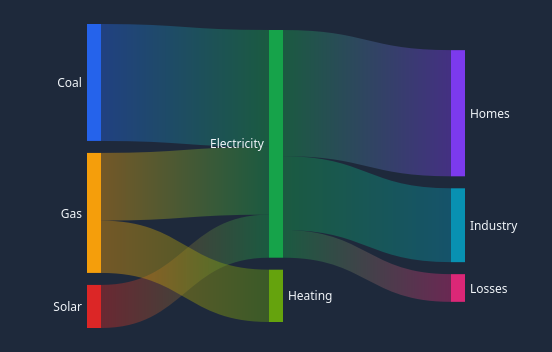
Dark theme
Colours come from the design tokens, so the widget follows the app theme with no extra work.
Properties
Every property below is settable in code and in Qt Designer.
| Property | Type | Default |
|---|---|---|
linksCsv | string | — |
nodeColorsCsv | string | — |
nodeWidth | int | 14 |
nodePadding | int | 12 |
linkOpacity | float | 0.4 |
curvature | float | 0.5 |
showLabels | bool | True |
showValues | bool | False |
labelColor | color | #0f172a |
Signals
| Signal |
|---|
linkHovered(int) |
nodeClicked(QString) |
nodeHovered(QString) |
Methods
| Method | Description |
|---|---|
clearLinks() | Clear the links. |
columns() | [[node, ...], ...] left to right. |
curvature(*args, **kwargs) | Curvature. |
isSink(name) | True when nothing flows out of a node. |
labelColor(*args, **kwargs) | Label color. |
linkAt(pos) | Link at. |
linkCount() | Link count. |
linkHovered(...) | Link hovered. |
linkOpacity(*args, **kwargs) | Link opacity. |
links() | Links. |
linksCsv(*args, **kwargs) | Links csv. |
nodeAt(pos) | Node at. |
nodeClicked(...) | Node clicked. |
nodeColor(name) | Node color. |
nodeColorsCsv(*args, **kwargs) | Node colors csv. |
nodeDepth(name) | Column index: the longest path from any source-only node. |
nodeDepths() | Node depths. |
nodeHovered(...) | Node hovered. |
nodePadding(*args, **kwargs) | Node padding. |
nodeRects() | Node rects. |
nodeValue(name) | Throughput: the larger of what flows in and what flows out. |
nodeWidth(*args, **kwargs) | Node width. |
nodes() | Every node name, in first-seen order. |
ribbons() | Ribbons. |
setLinks(links) | Replace every link. Self-loops, zero flows and unnamed ends are |
showLabels(*args, **kwargs) | Show the labels. |
showValues(*args, **kwargs) | Show the values. |
Theming
Colours come from the design tokens, so they follow the active theme. Roles used: on-surface.
See Design tokens.
Related
QCustomAreaChart · QCustomBarChart · QCustomBeeswarm · QCustomBubbleChart · QCustomCandlestickChart · QCustomCompass · QCustomCompassDial · QCustomDivergingBarChart